
Page 3 - OHKF_GBA_Leaflet_176x250_EN
P. 3
3. Survey Results and
Policy Directions
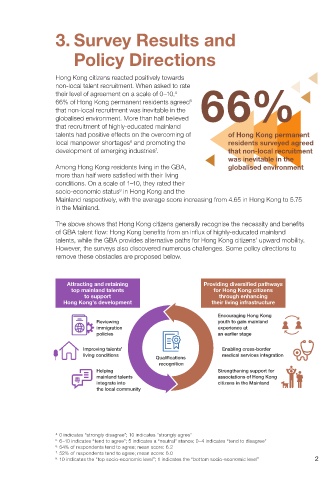
Hong Kong citizens reacted positively towards
non-local talent recruitment. When asked to rate
4
their level of agreement on a scale of 0–10,
5
66% of Hong Kong permanent residents agreed 66%
that non-local recruitment was inevitable in the
globalised environment. More than half believed
that recruitment of highly-educated mainland
talents had positive effects on the overcoming of of Hong Kong permanent
local manpower shortages and promoting the residents surveyed agreed
6
7
development of emerging industries . that non-local recruitment
was inevitable in the
Among Hong Kong residents living in the GBA, globalised environment
more than half were satisfied with their living
conditions. On a scale of 1–10, they rated their
8
socio-economic status in Hong Kong and the
Mainland respectively, with the average score increasing from 4.65 in Hong Kong to 5.75
in the Mainland.
The above shows that Hong Kong citizens generally recognise the necessity and benefits
of GBA talent flow: Hong Kong benefits from an influx of highly-educated mainland
talents, while the GBA provides alternative paths for Hong Kong citizens’ upward mobility.
However, the surveys also discovered numerous challenges. Some policy directions to
remove these obstacles are proposed below.
Attracting and retaining Providing diversi ed pathways
top mainland talents for Hong Kong citizens
to support through enhancing
Hong Kong’s development their living infrastructure
Encouraging Hong Kong
Reviewing youth to gain mainland
immigration experience at
policies an earlier stage
Improving talents’ Enabling cross-border
living conditions Quali cations medical services integration
recognition
Helping Strengthening support for
mainland talents associations of Hong Kong
integrate into citizens in the Mainland
the local community
4. 0 indicates “strongly disagree”; 10 indicates “strongly agree”
5. 6–10 indicates “tend to agree”; 5 indicates a “neutral” stance; 0–4 indicates “tend to disagree”
6. 54% of respondents tend to agree; mean score: 6.2
7. 52% of respondents tend to agree; mean score: 6.0
8. 10 indicates the “top socio-economic level”; 1 indicates the “bottom socio-economic level” 2