
Page 12 - Demo
P. 12
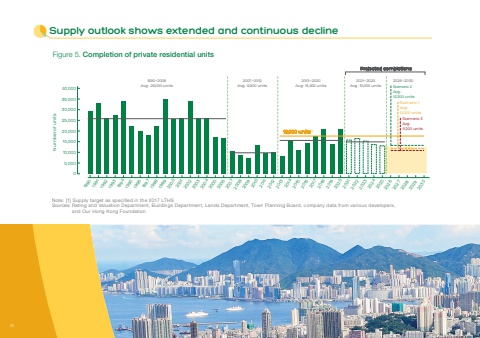
Supply outlook shows extended and continuous declineNote: [1] Supply target as specified in the 2017 LTHSSources: Rating and Valuation Department, Buildings Department, Lands Department, Town Planning Board, company data from various developers,and Our Hong Kong Foundation Number of units18,000 units[1]19901991199219931994199519961997199819992000200120022003200420052006200720082009201020112012201320142015201620172018201920202021202220232024202520262027202820292030 5,0000 10,000 15,000 20,000 25,000 30,000 35,000 40,0002026—2030Scenario 2Avg.:13,300 unitsScenario 1Avg.:12,000 units2013—2020Avg.: 15,400 units2007—2012Avg.: 9,900 units2021—2025Avg.: 15,000 units1990—2006Avg.: 26,000 unitsFigure 5. Completion of private residential unitsScenario 3Avg.:11,200 unitsProjected completions10
